Histogram Settings
When you capture an image, the system will automatically display a histogram that measures and graphs the brightness and contrast characteristics of the image. The histogram is displayed in the Histogram Panel. You can view and analyze the histogram and manipulate it to enhance the image. To change the size of the histogram, you can change the size of the panel in which it resides. See Display Customization.
You can move the red histogram pointers to adjust the image's screen display settings. The red points represent minimum and maximum brightness for the displayed image.
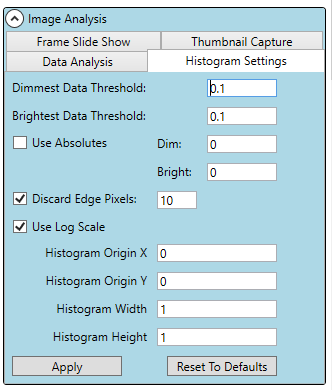
This panel displays parameters that influence the histogram display and the calculations it provides (std, mean, mode, median). After making changes to Histogram Settings, click Apply to update the histogram.
Dimmest Data Threshold
This parameter accepts a percentage as input. The X% of the dimmest pixels will be discarded from the
histogram display and calculations.
Brightest Data Threshold
This parameter accepts a percentage as input. The X% of the brightest pixels will be discarded from the
histogram display and calculations.
The process of converting the sensor pixel values to monitor pixel values maps a potentially very high number of
values to a constant 256 values. The center 80% of image data is mapped to pixel values between 0 and 255
by default. This can be changed with the Dimmest / Brightest Data Threshold. As exposure increases, the
range of values to be mapped increases. The result of this is fewer pixels being displayed as bright, and the
image being displayed darker.
Use Absolutes
Use the given absolute Bright and Dim values as fixed thresholds to draw the histogram. When not active,
values will be calculated based on the percentages given above.
Dim
The absolute dimmest pixel value used to draw the histogram.
Bright
The absolute brightest pixel value used to draw the histogram.
Discard Edge Pixels
When enabled, the histogram discards the entered number of pixels on the left and right edges of the image
from the histogram display and calculations.
Use Log Scale
The histogram's x-axis can be displayed in two different scales. A linear histogram is a representation of how
the camera sees the data. A logarithmic histogram is a representation of how our eyes see the data. If the
checkbox is enabled, the logarithmic scale is used.
Histogram Origin X, Y, Width, Height
These parameters allow manual selection for the region displayed in the histogram. One can enter an x and y
coordinate and a width and height, or one can use the right mouse button to click and drag over an area to
select the intended region. Remember to click apply after either input to update the histogram.
Apply
Pressing this button applies the settings to the image displayed.
Reset To Defaults
If erroneous changes occur due to Histogram Settings, press reset to default to start over with the values preset
by the system.
Finger Lakes Instrumentation, a division of IDEX Health & Science
1250 Rochester St.
Lima, New York 14485
1250 Rochester St.
Lima, New York 14485
Phone: 585-624-3760
Email: IHSKeplerSupport@IdexCorp.com
Web: www.flicamera.com
Email: IHSKeplerSupport@IdexCorp.com
Web: www.flicamera.com
©2023 IDEX Health & Science